
| Price | Free |
|---|---|
| Category | Finance |
| Version | 2.5 |
| Developer | Proseon Inc |
| Added | Apr 2nd, 2012 |
| App Views | |
| Votes | 0 votes |
| Google Rating | |
| Ratings | 195 |
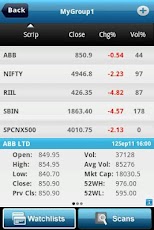
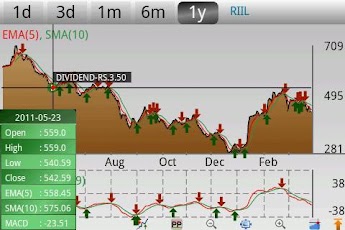
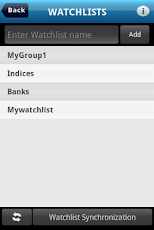
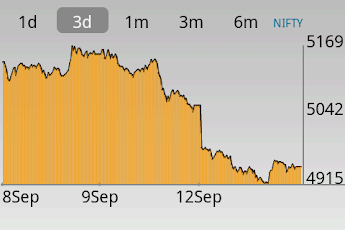
View NSE Stock Charts (Line and Candlestick) with Buy/Sell signals to help you make Buy/Sell decisions using Technical Indicators like EMA,SMA,Stochastics,MACD,RSI, maintain watchlists of stocks in Indian Stock Market(NSE), view intraday support/resistance levels, and get new ideas everyday based on Volume Gainer/Loser and New High/Low scans. The LIVE intraday quotes and intraday charts auto-update every 5 mins. Quickly flip through daily and intraday stock charts to find stocks of interest and add it to your watchlists. Currently only NSE stocks are supported.The scans are End-of-Day NSE scans with intraday updates. It means that the stocks in the scans will change based on the EOD data but their stock prices are updated every 5-mins real-time throughout the day (stock prices are updated automatically, no need to click on the refresh button).In this FREE app, you can add up to 3 watchlists with a limit of 10 scrips per watchlist with 5-min real-time updates for all NSE stocks.We now provide Watchlist Synchronization as a new feature with the latest update of the application. It allows user to keep a backup of their watchslists and/or synchronize their watchlists with the desktop software Investar 3.0.You can also make an in-app purchase to create unlimited watchlists. The cost of paid add-on also includes FREE intraday data updates for unlimited NSE stocks for 1 year. Technical Analysis features are also supported. When you are in landscape mode, you can switch between line and candlestick charts. Technical Indicators like EMA,SMA,RSI,MACD,Stochastics can be added. By switching to interactive mode, you can use a cross-cursor to quickly navigate to any point in the chart. End-Of-Day charts are completely FREE. Intraday Charts with automatic 5-min real-time updates and Buy/Sell signals can be enabled by purchasing the Technical Analysis Add-On.Swipe the chart in the landscape mode towards right or left to view all the charts of the currently selected Watchlist. This helps you to analyze all the charts of the selected watchlist one after another.You can add multiple NSE scrips easily and also add any scrip traded on NSE by symbol lookup. You can change watchlists easily by swiping a watchlist name left or right. Context-sensitive help is available from most screens of the application.KW: indian stock market, indian stocks, nse stocks, intraday, live, live quotes, live market watch, live stock charts, indian share market, indian shares
App Screenshots
Other Finance Apps