
| Price | Free |
|---|---|
| Category | Finance |
| Version | 1.4 |
| Developer | BitPedal |
| Added | Apr 16th, 2011 |
| App Views | |
| Votes | 0 votes |
| Google Rating | |
| Ratings | 5 |
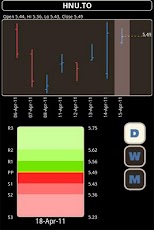
Pivot Trader is a convenient tool for Android devices that displays pivot point levels for a list of securities in a customizable portfolio. Levels can be refreshed daily with end-of-day data from the quotes server, and viewed in several time frames.Pivot Trader defines price levels as follows:P = (H + L + C) / 3R1 = P + (P – L) = 2×P – LS1 = P – (H – P) = 2×P – HR2 = P + (H – L)S2 = P – (H – L)R3 = P + 2×(H – L)S3 = P – 2×(H – L)Common trading strategy using pivot points* If price opens above previous session’s pivot point (PP), sentiment is bullish* If price opens below previous session’s pivot point (PP), sentiment is bearish* On bullish sentiment, use resistance levels (R1, R2, R3) to close a long position* On bearish sentiment, use support levels (S1, S2, S3) to cover a short position* Use a longer pivot time frame than the time frame you are trading in (ex: use monthly or weekly pivots when trading daily charts)* For intra-day trading, use volatility indexes as additional confirmation of sentiment (^VIX, ^VXN)
App Screenshots

Other Finance Apps